


National CRE News In Your Inbox.
Sign up for Connect emails to stay informed with CRE stories that are 150 words or less.


EY: Five Takeaways from a Recent Look at Office Trades
By Brett Johnson, Mark Grinis and Katie Miller
Pre-pandemic, the office sector was a long-established, relatively stable, and generally promoted asset class for real estate investment. Today, stories surrounding the office sector crumbling are dominating front page news. Never before has the office received so much media attention portraying the asset class in a negative light.
There is some obvious cause for concern. Since the pandemic, there has been an uptick in the adoption of hybrid work policies among employers, with nearly half of employees across industries working from home three days a week on average, according to the EY Future Workplace Index 2.0, a poll of 500 companies across various industries. Hybrid work, coupled with movement out of coastal urban areas and a heightened focus on sustainability among corporate tenants has softened demand for office space nationally. As vacancy rises in some once-busy downtown cores, and employers evaluate new ways of working, office properties have come under investor scrutiny, contributing to a rising perception that the need for physical workspace is diminishing.
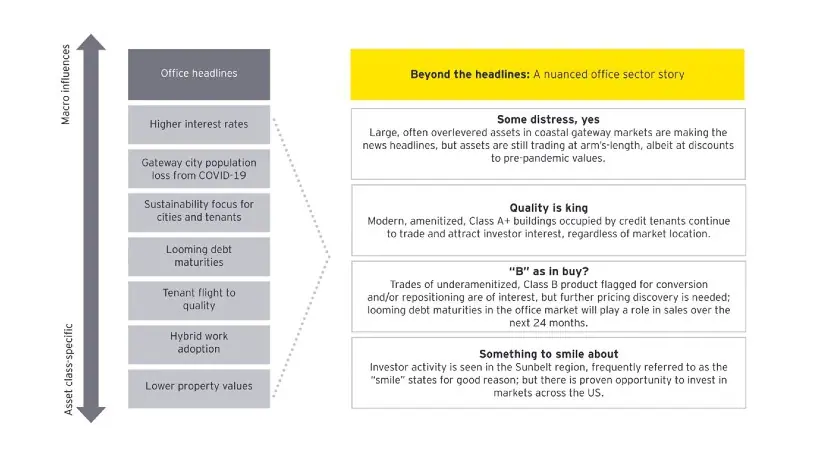
The narrative unfolding in the media is grim, painting an apocalyptic picture for office. With more than $6+ billion of looming office debt maturities in the CMBS markets in 2023 alone, pricing discovery is both necessary and likely imminent in the office market. But when we look beyond the news headlines, what does the data tell us? In short, as each property carries unique locational, quality and tenant characteristics that reveal a unique building profile. There’s more to the office sector than what initially meets the eye.
The office sector can look bleak from afar, but when you zoom in, there are multiple narratives unfolding simultaneously; some revealing cautionary tales, and others of great opportunity.
Overview of EY analysis
EY professionals analyzed trades of office properties greater than 25,000 square feet (SF) across the US market transacting between June 2022 and June 2023. Additionally, KPIs such as vacancy, absorption and inventory in the top 25 office markets nationally were reviewed. The key takeaways of the analysis are below.
Top 5 takeaways from a closer look at the office sector
1. There is some truth to the headlines, but the story in office isn’t uniform
The “office story” is not a singular trend. A closer look at the drivers of office demand reveal variations in property quality, market dynamics, and asset performance and capitalization that tell a nuanced story for the asset class:
2. Distressed properties are the minority of sales – so far
More than 1,000 office assets have changed hands between June 2022 and June 2023. Of the $50+ billion in sales, these properties commanded only a fraction of sales by deal value and property count represent distressed scenarios.
Undoubtedly, there are rising levels of pressure from both economic and secular headwinds within the office sector, and large properties making headlines may foreshadow additional stress. However, a closer look at recent trades suggests distress is not fully pervasive in the office sector – yet – and further, is not concentrated solely in gateway cities. Transaction data indicates that distressed sales to date have occurred both in primary and secondary markets, and in properties of various building size and positioning.
Naturally, with a high volume of office mortgages coming due over the next 12 months, additional office mortgages could be at risk for default. Data from commercial real estate research firm Trepp supports some heightened caution in office, as office CMBS mortgages posted the highest increase in special serving rates as of June 2023, albeit the rate hovers around 7.24%. Maturing loans will shape the trajectory of the office story and can induce transaction activity in the short term and may lead to both distressed and arm’s-length deals, albeit the type of loan (e.g., CMBS vs. traditional bank loans) will also influence transaction activity ahead.
3. Who’s buying and who’s selling is telling
The buyer types entering and exiting the office sector also shed light on the current environment. While certain players have remained active in the space, a closer look into the entities completing transacts reflects the nuanced story in the sector:
- Developers are the current dominant buyer of office properties: Developers acquired nearly 50% of office properties transactions between June 2022 and June 2023, per EY analysis. The propensity of well-capitalized developers to buy in a heightened interest rate environment reflects their higher risk appetite to transact and renovate or repurpose often well-located assets into alternate property types.
- Private equity sold 1.5 times the volume of office than they acquired in the time period studied: This reflects the leverage model utilized by private equity, and the lack of available credit over the past 12 months. However, as additional pricing discovery enters the office market, and concerns from institutional players moderate, private equity is expected to be a more active player.
- A diverse set of buyers are still at play: Sovereign wealth funds were net buyers of office assets by number of assets acquired, notably out of Asia, a region that EY research indicates has more favorable attitudes toward in-person work. Corporate users are still strategically buying, particularly in the technology, telecom and consumer industries. Public sector players, notably education and government entities, were also net buyers of office assets over the 12-month time frame analyzed.
Generally speaking, the transaction data analyzed suggests that multiple factors may influence transaction trends going forward, including a given investor’s current exposure to office.
4. Pockets of activity beyond the largest office markets is something to smile about
Over the past decade, and further accelerated by migration patterns since the global pandemic, investors have heightened their focus on property in the “smile” states, otherwise known as the US Sunbelt region. Stretching from southern California, across Texas and over to Florida, the Sunbelt region has attracted those relocating from larger, coastal cities due to favorable weather conditions, population increases, corporate relocations and a lower cost of living.
As it relates to indicators of health in the office market, major employment centers in the “smile” states have generally weathered the storm when compared with coastal peers. Construction activity in large “smile” state cities such as Houston and Dallas is outpacing pre-COVID 19 levels. Cities such as Dallas and Phoenix have experienced a double-digit base rent increase in office since 2019, according to EY analysis.
While the “smile” state activity is encouraging for office, a closer look at the data reveals nuanced opportunity in the sector:
- Salt Lake City is a growing hub for health and technology sector employers and offers a brighter spot for office demand. As of mid-2023, Salt Lake City led the country in leasing activity relative to pre-pandemic levels in the time period analyzed by EY professionals.
- Construction activity in San Diego increased by a factor of 3x since first quarter 2019, resulting from activity in the technology and medical sectors. Heightened demand for new construction in flex office and life sciences was also noted in Boston.
- The New Jersey office market posted the smallest increase in vacancy of 200 basis points between January 2019 and June 2023, despite broader office sector headwinds, as favorable supply dynamics and population movement in the suburbs offer a pricing alternative for corporate tenants.
Generally, a double click into the transaction data reveals the nuances of the office sector. Investors should be wary of potentially overlooking opportunity in seemingly troubled markets, as the characteristics of a given submarket may diverge from overall market trends.
5. Depending on your risk appetite, there is opportunity to buy
The next few years will be critical for understanding the long-term trajectory for office. As interest rates stabilize, tenant leases rollover and assets transact again, a “new normal” will be found in the office sector. Transaction data from June 2022 to June 2023 is already showing multiple pathways for investment in the office sector across the risk spectrum.
For patient capital seeking stable investments, highest quality, Class A+ properties continue to offer long-term investment opportunities. In analyzing the 10 largest office trades between June 2022 and June 2023, nine of the 10 properties were Class A assets with 90% or greater occupancy from credit tenants, affirming a flight to quality trend that has accelerated since the pandemic. Additionally, according to the EY Future Workplace Index 2.0, approximately 60% of corporate tenants surveyed indicated they intend to invest in their real estate portfolios, affirming the desire of employers to provide physical space to in-person work and team collaboration.
Class B and underinvested office assets, on the other hand, are experiencing heightened concerns around condition, ability of owners to upgrade, healthy building attributes, lack of amenities, sustainability compliance, tenant sentiment and heavy capital expenditure needs. Yet, transaction data reveals these assets are still trading at notable volumes. Opportunities to renovate, reposition and/or convert to alternate property types, particularly in markets with accommodating zoning environments, remain enticing to well-capitalized investor types. Some municipalities are going on the offense to attract such capital in the form of economic incentives and tax abatements.
The varying levels of investor risk appetite – and resulting opportunity – can be found in analyzing a market like Chicago. Between June 2022 and June 2023, the Chicago metropolitan area led the country in number of office properties traded, exceeding $1 billion in deal volume. Looking behind the 50+ deals that closed, there are several themes that highlight the stratified opportunity in the office market:
Of properties that had traded ownership hands before, the vast majority of sales sold at a lower price than what the asset previously sold at, affirming the impact of macroeconomic influences and negative investor sentiment toward the asset class.
However, approximately 10 trades observed were Class A buildings with 95% or greater occupancy; these assets were mostly secured by long-term leases, often by a single tenant (both third party and occupier via sale-leaseback were noted). While hybrid work is undoubtedly on the rise, as companies evaluate new ways of working, some component of physical space is almost always in consideration, as 75% of respondents from the EY Future Workplace Index 2.0 making no change or increasing (38% of respondents) the amount of office space since the pandemic.
Eight trades of Class B assets slated for conversion and/or adaptive reuse were noted, with intended conversions to industrial, hotel and multifamily uses all cited. It should be noted that as part of an economic development initiative, the city of Chicago represents a leading urban area offering incentives around the redevelopment of existing properties. Policies such as the Class L and Class 6(b) property tax incentives, which offer a 12-year reduction in property tax assessments for qualifying industrial and commercial conversion projects, were designed to entice developers to renovate and repurpose existing assets within the city.
What will tomorrow’s headlines read?
As evidenced from recent trades, the office sector offers investors both cause for concern and the promise of opportunity. While no one has a crystal ball, what lies ahead for the asset class over the next 24 months will be impacted by a few key factors. The pending wave of office mortgage maturities and stabilization in the debt markets will inevitably trigger transactions and lead to pricing discovery in the asset class.
Additionally, it remains unclear if employers will utilize real estate as a cost savings lever in the current environment, and how misalignments between employee and employer interests around in-person office presence will settle. Overall, the actions of current and future real estate stakeholders, including corporate tenants, lenders (including future sources of financing) and cities, will all play an important role in shaping the future of the office sector.
Even in strained economic conditions and tighter lending environments, there will still be multiple pathways for investment in office. Favorably positioned Class A+ buildings will continue to transact and operate as office for the foreseeable future. And Class B and C properties are ripe to transact upon future pricing discovery, holding the potential for repositioning and/or repurposing to alternate property uses by opportunistic capital.
Approaching the office sector with caution is understandable in the current environment. However, as the debt markets stabilize and pricing discovery is found, opportunities in office await strategic investors who read beyond the news headlines.
Brett Johnson is EY US Strategy and Transactions Real Estate Valuation Solutions Leader. Mark Grinis is EY Americas Real Estate, Hospitality & Construction Leader. Katie Miller is EY Americas Strategic Operations Leader. Jordan Schott, EY US Strategy and Transactions, Manager, also contributed to this article.

